
SEOMURAI Documentation
The SEOMURAI Score and the most important findings at a glance.
The Dashboard is the default view of SEOMURAI and delivers a well-founded assessment of the currently open page in under two seconds. Go to the documentation overview.
Free in every SEOMURAI plan.
What the Dashboard in SEOMURAI does
The Dashboard combines the results of all analysis modules into a single, weighted rating and presents the most important findings in order of priority. Instead of sending you through seven menus, it first answers the question that matters to everyone responsible for SEO: how is this page doing right now? And if the answer is not satisfactory, where is the best place to start?
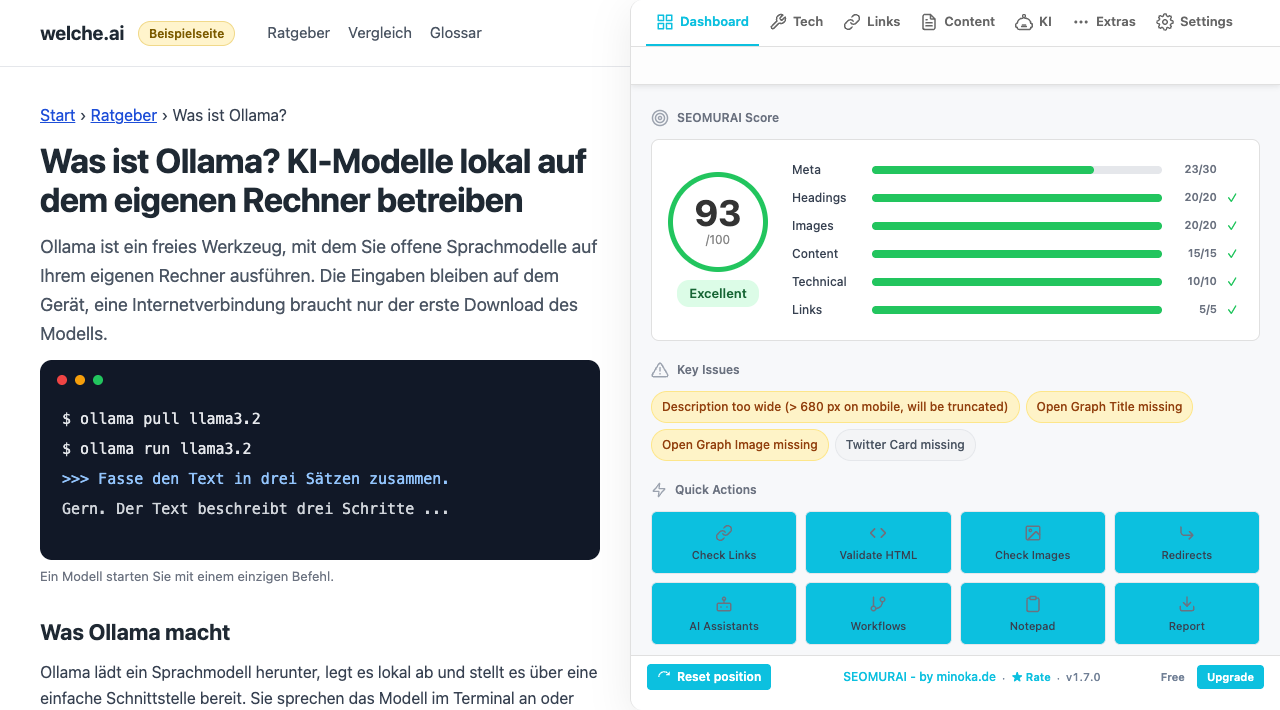
Four areas make up the Dashboard: the SEOMURAI Score as an overall grade from 0 to 100, the Key Issues list with up to five findings as a prioritized task list, the Quick Overview with key figures on content, structure, links, images, meta and technical signals, and the Quick Actions, which jump directly to the evaluations you need most often.
When the Dashboard is especially useful
- As the default starting point for every SEO session, before you move into individual modules.
- When you only want to assess a page briefly, for example during research or while watching a competitor.
- Before and after larger content changes, to get a quick before-and-after assessment.
- When you want to show a colleague or a client where a page stands within a few seconds.
- During a first audit, to estimate the effort the following measures will require.
Step by step
1. Open SEOMURAI, the Dashboard is the default view
Click the SEOMURAI icon in the toolbar. The extension opens and shows the Dashboard right away. If you were previously working in a different tab, the page you are currently on is analyzed automatically, no separate action is required.
2. Interpret the SEOMURAI Score
The score is a color-coded overall grade from 0 to 100. The color gives you an immediate assessment:
- Green (roughly 80 and above): The fundamentals are clean, minor optimizations are all that remain.
- Yellow (roughly 60 to 79): There are several places where effort will pay off.
- Red (below 60): At least one central SEO element is missing or set incorrectly, this is where you should start.
The score is a weighted aggregation of tech SEO signals (title, meta description, canonical, headings hierarchy, schema), content signals (word count, readability, images with alt text), link signals and technical signals (HTTP status, redirect path, viewport, language).
3. Prioritize the Key Issues (five at most)
Directly below the score, Key Issues lists up to five findings on the page, weighted by SEO impact. Every entry is clickable: one click switches automatically to the tab that covers the issue in detail and shows the matching recommendation together with a note on proven best practices. This saves you the manual route through the menu.
4. Scan the Quick Overview
The Quick Overview delivers compact key figures in five categories:
- Content: Number of words, estimated reading time.
- Structure: Number and distribution of headings.
- Links: The ratio of internal to external links.
- Images: Total count and the share with alt text.
- Meta & Technical: Title and description with their pixel width, the canonical tag and the first schema type found.
These figures do not replace a deep analysis, but they give you a realistic sense of the magnitudes you are dealing with.
5. Use Quick Actions to jump straight to the most common tasks
Directly below Key Issues you will find eight Quick Actions: Check Links, Validate HTML, Check Images, Redirects, AI Assistants, Workflows, Notepad and Report. Seven of them jump to the matching area, with AI Assistants and Workflows leading into PRO areas. Report downloads the analysis as a JSON file. This spares you the route through the main menu when you already know what you want to do next.
Frequently asked questions
Tips and frequently asked questions
How are the Key Issues selected?
The selection follows a weighting by SEO impact: findings with a high impact on indexing, visibility or user experience appear at the top. For example, a missing title tag ranks higher than missing alt texts. The order is deterministic, a page with identical findings always produces the same order.
My score is stable, but a new issue has appeared. Why?
The score is a weighted aggregation. A new issue with a low weight can appear without noticeably lowering the overall value. Conversely, fixing a highly weighted finding can raise the score by several points. The Key Issues list shows you at any time what carries the most weight.
Can I set a different default tab?
Yes. Under Settings → General → Default Tab you can choose which tab is active when the extension opens. You can choose the Dashboard or any single subtab, such as Meta, Schema or Text Analysis. If you almost always work on meta tags, setting Meta as the default is worthwhile, otherwise we recommend the Dashboard.
Does the Dashboard update automatically when the page changes?
No. SEOMURAI analyzes the page once when the extension opens and keeps the results for the current session. If you have changed or reloaded the page, close SEOMURAI and open it again so that the Dashboard reflects the current state.
Which Quick Actions are included exactly?
Eight: Check Links, Validate HTML, Check Images, Redirects, AI Assistants, Workflows, Notepad and Report. AI Assistants and Workflows lead into PRO areas, and Report downloads the analysis as a JSON file. The selection is based on the tasks needed most often in a typical audit session. Customizing the Quick Actions is deliberately not provided in the current version, so that the entry point stays familiar across multiple sessions.
More topics in the documentation
Jump directly to the detail page for another menu.
- Overview: Getting started with SEOMURAI
- Tech SEO: Meta, Schema, Headings and seven more subtabs
- Links: Statistics, Analyse, Duplicates, Outlink Checker
- Content: Text Analysis, Keyword Highlighter, Image SEO, Image Analysis
- KI: LLMS.TXT Info and PRO modules
- DataForSEO: SERP, keywords, domain data and backlinks (BYOK)
- External checkers: W3C validator, Rich Results Test and context menu
- Settings: Language, API keys, backup and account
Want to try this feature directly in your browser?
Install SEOMURAI, open any page and read the Dashboard as an honest first assessment.